📈 LEVEL 6: Reporting & VISUALIZATION
🔹 PART 1: What is a Chart?
📌 Definition
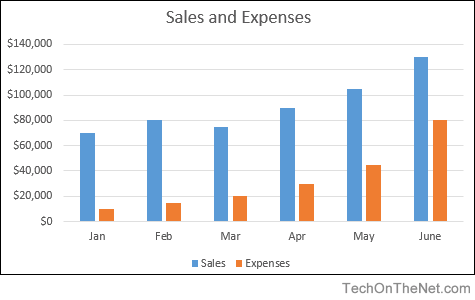
A chart is a visual representation of data.
Charts help to:
- Compare values
- See trends
- Present reports clearly
- Create dashboards
📌 Rule of thumb:
Numbers for calculation, charts for explanation
🔹 PART 2: Column, Bar, Line, Pie Charts
We’ll use one sample dataset for all charts.
📊 Sample Data (Type This)
| Month |
Sales |
| Jan |
20000 |
| Feb |
25000 |
| Mar |
18000 |
| Apr |
30000 |
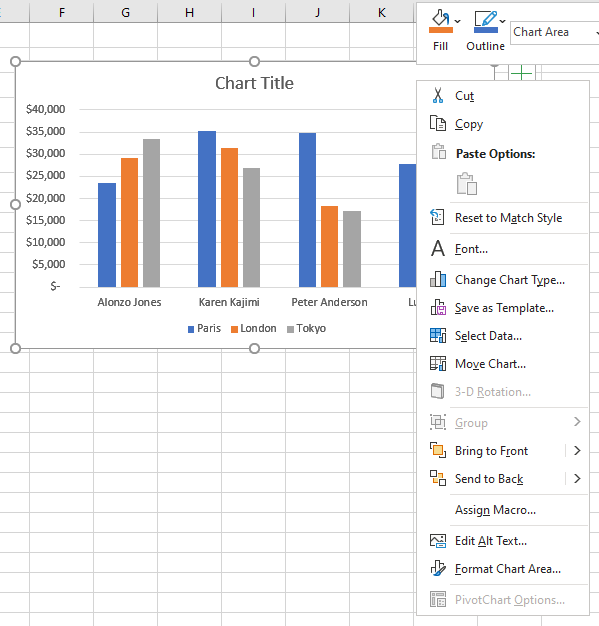
1️⃣ Column Chart (Most Common)